Orthogroup filtering
Gareth Gillard, Lars Grønvold
22/06/2020
# All orthogroups
OGtbl <- read_tsv("input-data/from_ortho_pipeline/OGtbl.tsv",col_types = cols())

# Expression matrix with all genes per species
exprsMat <- readRDS("input-data/RNAseq/exprsMat.RDS")

# list of all genes in the expression matrices
genesInExprsMat <-
  lapply(exprsMat,function(m){
    return(tibble(geneID=rownames(m)))
  }) %>%
  bind_rows(.id="spc")

# load gene trees
allTrees <- readRDS("input-data/from_ortho_pipeline/allTrees.RDS")

# Species tree from orthofinder
spcTree <- read.tree("input-data/from_ortho_pipeline/SpeciesTree_rooted_node_labels.txt")
The orthogroups
Orthogroups (OGs) are based on the gene trees from the orthology/synteny pipeline(The 2019-03 version). This pipeline takes the protein sequences (longest isoform per gene) from each species and clusters into OGs using OrthoFinder. The corresponding CDS’s in each ortholog group are then aligned and used to generate gene trees. These trees are split into teleost clades/orthogroups (internal node “N3” in the species tree) which we will refer to as trees/clades/orthogroups.
Filtering
Filtered is based on the phylogeny, gene copy-numbers and gene expression:
- No out-group paralogs, i.e. Max 1 gene per out-group species (Drer, Olat, Eluc) per N3 clade
- No salmonid paralogs, i.e. Max 1 gene per in-group/salmonid species (Ssal, Salp, Omyk, Okis) in each of the salmonid clade (N9)
- Either 1 (singleton) or 2 (duplicate) salmonid clades (N9)
- One salmonid ortholog must be expressed (one or more mapped RNA-seq reads).
- The Eluc ortholog and either Drer or Olat must be expressed.
- Duplicate salmonid clades (N9) must form a monophyletic clade within the teleost clade (N3)
#### Topology requirements ####

# how many N9s per N3
N9sPerN3 <-
  OGtbl %>%
  select(N3,N9) %>%
  filter( !is.na(N9)) %>%
  distinct() %>%
  count(N3) %>% rename( nN9s = n)

# how many of each out-group species per N3
OutSpcPerN3 <-
  OGtbl %>%
  select(N3,spc) %>%
  filter(spc %in% c("Drer","Olat","Eluc")) %>%
  count(N3,spc) %>%
  spread(key=spc,value=n) %>%
  mutate_at(vars(-N3), ~ ifelse(is.na(.),0,.))

# generate table of N9 clades with relevant stats
N9tbl <-
  OGtbl %>%
  filter(!is.na(N9)) %>%
  select(N3, N9,spc,geneID) %>%
  count(spc,N9,N3) %>%
  spread(key=spc,value = n,fill = 0) %>%
  mutate( nSpcs = (Okis>0) + (Omyk>0) + (Salp>0) + (Ssal>0) ) %>%
  left_join( OutSpcPerN3, by="N3") %>%
  mutate_at(vars(Eluc, Olat, Drer), ~ ifelse(is.na(.),0,.)) %>%
  mutate( hasInParalog = Okis>1 | Omyk>1 | Salp>1 | Ssal>1 | Drer>1 | Olat>1 | Eluc>1 ) %>%
  group_by(N3) %>%
  mutate(N3hasInParalog = any(hasInParalog)) %>%
  mutate(bothN9sAreFull = all(nSpcs==4)) %>%
  ungroup() %>%
  left_join( N9sPerN3, by="N3") %>%
  arrange( N3hasInParalog+hasInParalog,nN9s, nSpcs, Ssal, Salp, Omyk, Okis, Eluc, Olat, Drer )


# Additional topology requirement: all salmonids in each N3 clades must be contained with a single monophyletic clade
# Note: Not counting the two salmonids that are not included in this study (Hhuc and Tthy)

salmonids_all <- c("Tthy","Hhuc","Salp","Ssal","Okis","Omyk")
salmonids_used <- c("Salp","Ssal","Okis","Omyk")
# function to identify non-salmonids under the MRCA of the four salmonids used
checkMonophyletic <- function(tree){
  tipspc <- sub(".*(....)$","\\1",tree$tip.label)
  MRCAnode <- getMRCA(tree,tip = which(tipspc %in% salmonids_used))
  clade <- extract.clade(tree,MRCAnode)
  cladespc <- sub(".*(....)$","\\1",clade$tip.label)
  all(cladespc %in% salmonids_all)
}

# get the full tree (ignores the .XX suffix from the OG)
getTree <- function(OG){ allTrees[[sub("\\..*","",OG)]]@phylo }

duplicateN9sMonphyleticCheck <-
  filter(N9tbl, (nN9s) == 2 & !N3hasInParalog) %>%
  select(N3) %>% distinct() %>%
  # get N3 tree
  left_join(select(OGtbl,N3,geneID,spc), by="N3") %>%
  mutate( tip = paste(geneID,spc,sep="_")) %>%
  group_by(N3) %>%
  do( tree = keep.tip(getTree(.$N3[1]), .$tip) ) %>%
  ungroup() %>%
  # check phylogeny
  mutate( isMono = map_lgl(tree, checkMonophyletic)) %>%
  select(-tree)


# Table of N3+N9 clades passing the topology requirements:
# * no paralogs
# * no more than 2 N9 clades
# * duplicate N9 clades must form a monophyletic clade within the N3 clade
N9topologyPass <-
  N9tbl %>%
  left_join(duplicateN9sMonphyleticCheck, by="N3") %>%
  filter((nN9s) < 3 & !N3hasInParalog) %>%
  filter( nN9s==1 | isMono==T) %>%
  select(N3,N9)


#### require gene expression ####

# check for any expression (one read is enough)
expressedGenes <-
  lapply(exprsMat,function(m){
    isExpressed <- rowSums(m) > 0
    return(tibble(geneID=rownames(m)[isExpressed]))
  }) %>%
  bind_rows(.id="spc")


# at least one expressed in salmonids
N9withAtLeastOneExpressed <-
  N9topologyPass %>%
  left_join( select(OGtbl, N9, spc, geneID), by="N9" ) %>%
  filter( geneID %in% expressedGenes$geneID) %>%
  with( unique(N9))

# at least Eluc + one more expressed in outgroup
N3withAtLeastElucAndOneMoreExpressed <-
  N9topologyPass %>%
  select(N3) %>% distinct() %>%
  left_join( select(OGtbl, N3, spc, geneID), by="N3") %>%
  filter(spc %in% c("Drer","Olat","Eluc")) %>%
  filter( geneID %in% expressedGenes$geneID) %>%
  spread( key=spc, value=geneID) %>%
  filter( !is.na(Eluc) & !(is.na(Drer) & is.na(Olat))) %>%
  with(N3)

N9expressionPass <-
  N9topologyPass %>%
  filter( N9 %in% N9withAtLeastOneExpressed) %>%
  filter( N3 %in% N3withAtLeastElucAndOneMoreExpressed)


#### make geneID table ####

# remove geneIDs which are not found in the expression data
N3geneIDtbl <-
  N9expressionPass %>%
  select(N3) %>% distinct() %>%
  left_join( select(OGtbl, N3, spc, geneID), by="N3") %>%
  filter(spc %in% c("Drer","Olat","Eluc")) %>%
  filter( geneID %in% genesInExprsMat$geneID) %>%
  spread( key=spc, value=geneID)

N9geneIDtbl <-
  N9expressionPass %>%
  left_join( select(OGtbl, N9, spc, geneID), by="N9") %>%
  filter( geneID %in% genesInExprsMat$geneID) %>%
  spread( key=spc, value=geneID) %>%
  left_join(N3geneIDtbl, by="N3") %>%
  # remove duplicate clades where one has been removed by the expression filter
  add_count(N3) %>%
  left_join(N9sPerN3, by="N3") %>%
  filter( n == nN9s ) %>% # remove duplicate clades where one has been removed by the expression filter
  mutate( dup_type = c("single","duplicate")[n]) %>%
  select( -n, -nN9s ) %>%
  # Mark N9 clades as partial if it does not contain orthologs for all species
  mutate( N9partial=is.na(Okis)|is.na(Omyk)|is.na(Salp)|is.na(Ssal) ) %>%
  group_by(N3) %>%
  # Mark N3 clades as partial if any of the caontained N9 clades are partial
  mutate( N3partial = any(N9partial) ) %>%
  ungroup()


# save the geneID table
saveRDS(N9geneIDtbl,"data/orthoGroupFiltering/N9geneIDtbl.RDS")
Proportion of genes passing filter
The following plot shows the proportion of total genes in each species that are included in the tested OGs:
genesInExprsMat %>%
  group_by(spc) %>%
  do(
      notInOG = sum(!(.$geneID %in% OGtbl$geneID)),
      notTested = sum(!(.$geneID %in% N9geneIDtbl[[.$spc[1]]]))-sum(!(.$geneID %in% OGtbl$geneID)),
      single_complete = sum(.$geneID %in% filter(N9geneIDtbl,dup_type=="single"&(N3partial==FALSE))[[.$spc[1]]]),
      single_partial = sum(.$geneID %in% filter(N9geneIDtbl,dup_type=="single"&(N3partial==TRUE))[[.$spc[1]]]),
      duplicate_complete = sum(.$geneID %in% filter(N9geneIDtbl,dup_type=="duplicate"&(N3partial==FALSE))[[.$spc[1]]]),
      duplicate_partial = sum(.$geneID %in% filter(N9geneIDtbl,dup_type=="duplicate"&(N3partial==TRUE))[[.$spc[1]]])
    ) %>%
  unnest( everything() ) %>%
  gather(key = "tested", value = "n", -spc) %>%
  mutate(spc = factor(spc, levels = rev(c("Drer","Olat","Eluc","Omyk","Okis","Salp","Ssal")))) %>%
  mutate(tested = factor(tested,levels = c("notInOG","notTested","duplicate_complete","duplicate_partial","single_complete","single_partial"))) %>%
  ggplot(aes(x = spc, y = n, fill = tested)) +
  geom_col(colour = "black") +
  coord_flip() +
  scale_fill_manual(limits = c("notInOG","notTested","duplicate_complete","duplicate_partial","single_complete","single_partial"),
                    values = c("black","white","#e66101","#fdb863","#5e3c99","#b2abd2")) +
  theme_classic() +
  theme(text = element_text(size = 8, colour = "black"),
        axis.text = element_text(size = 8, colour = "black"),
        axis.ticks =  element_line(colour = "black"))
Species tree
Species tree phylogeny of the subset of species used in the study.
# Fish phylo tree
fish_tree <- keep.tip(spcTree, c("Drer","Olat","Eluc","Omyk","Okis","Salp","Ssal")) %>%
  rotateNodes("all") %>%
  rotate(c("Salp", "Omyk")) %>%
  rotate(c("Okis", "Omyk"))

# Change tip labels to full names
species_names <- c("Drer"="Zebrafish",
                   "Olat"="Medaka",
                   "Eluc"="Pike",
                   "Ssal"="Atlantic salmon",
                   "Salp"="Arctic char",
                   "Omyk"="Rainbow trout",
                   "Okis"="Coho salmon")
fish_tree$tip.label <- species_names[fish_tree$tip.label]
fish_tree.plot <- plot(fish_tree, align.tip.label = FALSE, adj = 0, edge.width = 2)

plot(fish_tree, align.tip.label = FALSE, adj = 0, edge.width = 2); axis(1)
Heatmap of copy number per OG
View heatmap counts of number of genes in orthogroups
# Create species count table
OG_species_counts <- OGtbl %>%
  filter(!is.na(N3), spc %in% c("Drer", "Olat", "Eluc", "Ssal", "Salp", "Omyk", "Okis")) %>%
  group_by(N3) %>% dplyr::count(N3, spc) %>% ungroup() %>% spread(spc, n)
# no. of N3 groups with correct species: 30,818

# Change NA values to 0
OG_species_counts[is.na(OG_species_counts)] <- 0

# Plot heatmap of species counts within the clans
OG_count_heatmap <- OG_species_counts %>%
  transmute(N3 = paste0(N3, "_"),
            Drer, Olat, Eluc, Omyk, Okis, Salp, Ssal) %>%
  data.frame(row.names = 1)
OG_count_heatmap[OG_count_heatmap > 3] <- 3
OG_count_heatmap <- OG_count_heatmap[rowSums(OG_count_heatmap)>0,]

OG_annot <- N9geneIDtbl %>%
  transmute(N3 = paste0(N3, "_"),
            dup_type = paste(dup_type, ifelse(N3partial,"partial","complete"))) %>%
  distinct() %>%
  data.frame(row.names = 1)

OG_annot_colours <- list(
  dup_type = c("single complete" = "#5e3c99", "duplicate complete" = "#e66101",
               "single partial" = "#b2abd2", "duplicate partial" = "#fdb863")
)

pheatmap(t(OG_count_heatmap),
          scale = "none",
          cluster_rows = FALSE,
          cluster_cols = TRUE,
          color = c("#FFFFFF", "#B3B3B3", "#4D4D4D", "#000000"),
          show_rownames = TRUE,
          show_colnames = FALSE,
          annotation_col = OG_annot,
          annotation_colors = OG_annot_colours,
          border_color =  NA,
          legend = TRUE)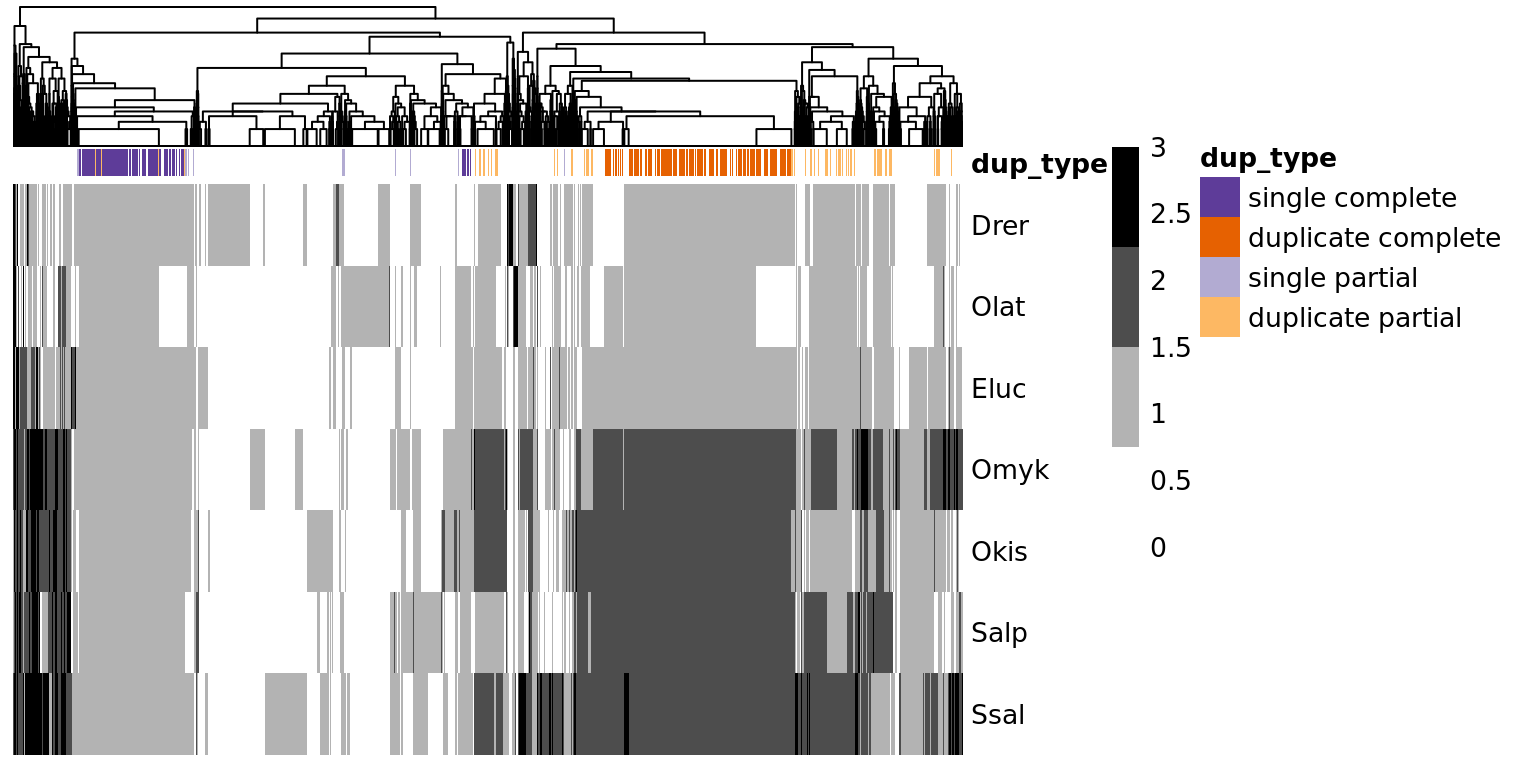
Some stats:
cat("Number of OGs:",nrow(OG_count_heatmap),"\n")## Number of OGs: 30818table(OG_annot$dup_type)##
## duplicate complete duplicate partial single complete single partial
## 4053 2346 2983 482